Chart patterns are an integral part of technical analysis. A chart pattern is a shape formed in the price chart that indicates what the prices are likely to go based on what has happened in the past. They provide a picture of the price action and form due to underlying buying and selling pressure. They are used for both short-term and long-term forecasts.
Read next article on analytical tools every trader should know
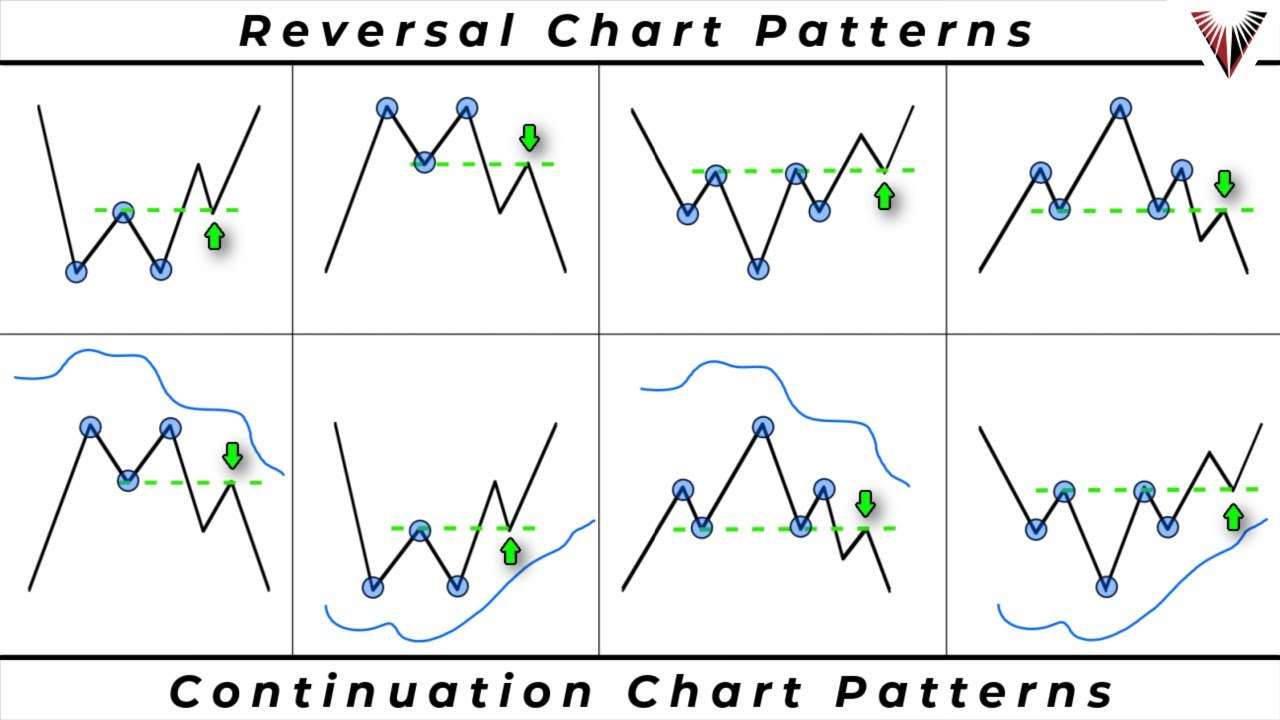
Chart patterns tend to repeat themselves, giving traders who understand these patterns a competitive advantage. Chart patterns can be classified into three sections, continuation patterns, reversal patterns, and bilateral patterns. Continuation patterns indicate that a trend is likely to continue while reversal patterns give reversal signals. Bilateral patterns indicate uncertainty and high volatility in the market.
Here are the top 10 chart patterns that every trader should know.
Table of Contents
Top 10 chart patterns every trader should know
1. Double top
A double top chart pattern highlights trend reversals. As the name suggests, a double top is makers by two swing highs around the same or slightly different price. It indicates that buyers could not push the price higher, and a trend reversal is imminent. An asset price reaches a peak before going back to the support line, and it then climbs once more and retraces back more permanently to reverse the trend. Traders should open a sell position once the price breaks the support line.
2. Double bottom
This pattern is a bullish reversal pattern that is the opposite of double top. It can be identified by seeing two sing lows. Here, the price peaks and retraces back to the resistance level. It forms a subsequent peak one more time and permanently reverses the current trend. It indicates that sellers were unable to move the price downwards. A trader’s signal to enter a position is when the price goes past the resistance line.
3. Triple top and triple bottom
This chart pattern is similar to double top and double bottom patterns. They are reversal patterns that have three swing highs and swings lows. Traders are advised to open a position once the price breaks the support and resistance lines.
4. Head and shoulders
This reversal chart pattern shows the market is about to change. It can be identified by seeing three swing highs, with the middle swing high being the highest. The last lower swing high indicates that the buyers did not have enough capacity to push the price higher. This pattern looks like a head and two shoulders, and the neckline connects the two shoulders. This serves as an entry sell position when prices go past the neckline. In a downward trend, the reverse is called an inverse head and shoulders pattern.
5. Cup and handle
This bullish continuation chart indicates that sellers are trying to push the prices lower, but the sentiment is continually changing from sellers to buyers. The cup resembles the rounding bottom chart pattern, and the handle looks like a wedge pattern. A pullback indicates the final attempt of the sellers trying to dominate the market.
After the rounding bottom, the price enters into a temporary retracement known as the handle. The price reverses out of the handle, and the overall bullish trend continues.
6. Rounding top
This chart pattern shows a slow change of the sentiment from bullish to bearish. When this happens, the price forms a rounded top. It may take some time for a rounding top to form. Traders can take advantage of this by entering a short position once the price breaks the support line.
7. Rounding bottom
It is a chart pattern that indicates either continuation or reversal. For example, in a bullish market, the asset price may fall back for a moment before rising once more in a bullish continuation.
The rounding bottom takes time to form, sometimes months to years. Traders can enter a position once the price goes past the resistance line.
8. Wedges
A wedge is an indication of a continuation pattern. Wedges are formed by joining two trend lines that converge. It can occur as a rising wedge or falling wedge. The trend lines converge as a result of sellers trying to push the prices lower but lack enough capacity compared to the buyers. Eventually, the buyers win, and the prices go past the upper trendline, showing that the upward trend will resume.
A rising wedge occurs when the price of an asset rises over time, while the falling wedge occurs when the price of the stock falls over time.
A wedge pattern is drawn by making trend lines and connecting the peaks and troughs. Once a price breakout occurs, there is a sharp movement of prices in either direction.
9. Flags
A flag is similar to a wedge, only that the trend lines that form are parallel, not converging. A flag pole is also part of the pattern. Flags can be bearish or bullish. A bullish flag forms in an upward trend and the parallel lines form above and below the price action, forming a down slope. A breakout above the price action indicates that the upward trend is set to resume. A bearish flag forms during a downward trend and has an up slope.
10. Triangles
Triangles come in three forms; ascending, descending, and symmetrical. Ascending triangles have a flat upper trendline, descending triangles have a flat lower trendline. The ascending triangle forms in an upward trend and is considered a bullish continuation pattern. It can also form at the end of a downward trend as a reversal pattern. However, it is commonly referred to as a continuation chart pattern. Ascending triangles are considered bullish patterns whenever they appear on charts.
Descending triangles are formed during a downtrend. It can also appear at the end of an upward trend; however, it is mostly a continuation chart pattern.
The symmetrical triangle is the most common and forms during both upward and downward trends. It forms converging trendlines, similar to the wedge pattern; however the slope is neither pointing up or down. The breakout point of the lower trendline in a downward trend shows that the downward trend is resuming. A breakout of the upper trendline in an upward trend shows an underlying uptrend.
Chart patterns are a vital component of technical analysis; however always remember the market is highly unpredictable, and there is no sure way of telling where the price goes next. As you employ these chart patterns in your traders, exercise due diligence and proper risk management.
All the best!
Disclaimer
Deriv offers complex derivatives, such as options and contracts for difference (“CFDs”). These products may not be suitable for all clients, and trading them puts you at risk. Please make sure that you understand the following risks before trading Deriv products: a) you may lose some or all of the money you invest in the trade, b) if your trade involves currency conversion, exchange rates will affect your profit and loss. You should never trade with borrowed money or with money that you cannot afford to lose.