
Trading Crash 500 and crash 1000 is similar to currency trading, however there are so many differences. The main difference is the average drop in the price series that occurs anytime within crash 1000 and crash 500 ticks.
Don’t be left out, Open a free trading account now by clicking here
For instance, if you placed a buy on crash 500 or Crash 1000 now, there are tendencies of a drop within some intervals. The drop always come so sudden that if you are trading against the trend you can loose all your capitals within just few drops depending on your lot size and equity.
This article will attempt to define a strategy that can assist you in your trading journey.
Table of Contents
The 3 Pips Strategy for Trading Crash 500 and Crash 1000
The two most used Forex strategy are fundamental analysis and technical analysis. While Fundamental analysis depends on indicators like:
- Consumer Price Index
- Non-farm Payrolls
- Retail Sales
- Purchasing Managers Index
Technical Analysis depends on indicators like:
- Relative Strength Index
- MACD
- Moving Averages
- Fibonacci lines.
- Stochastic Oscillator
- Average Directional Index
- Bollinger Bands
Scan here to start your trading journey now:

The combination of these tools is what helps traders to generate ideas that guide them on how they enter and exit the market with good profit or losses.
Let’s look at the 3 Pips strategy.
First, what is Pip?
Pip in a simple term is point in percentage which is the unit of measurement that express the change in value between two currencies.
You can read more on Pip here
The Strategy
Read also: How to Trade Boom and Crash Indices Successfully
This strategy needs just two indicators:
- Relative Strength index and
- 200 EMA

Fig 1: Indicator setup of the strategy

Fig 2: RSI setting
This strategy is very suitable for people with small capital
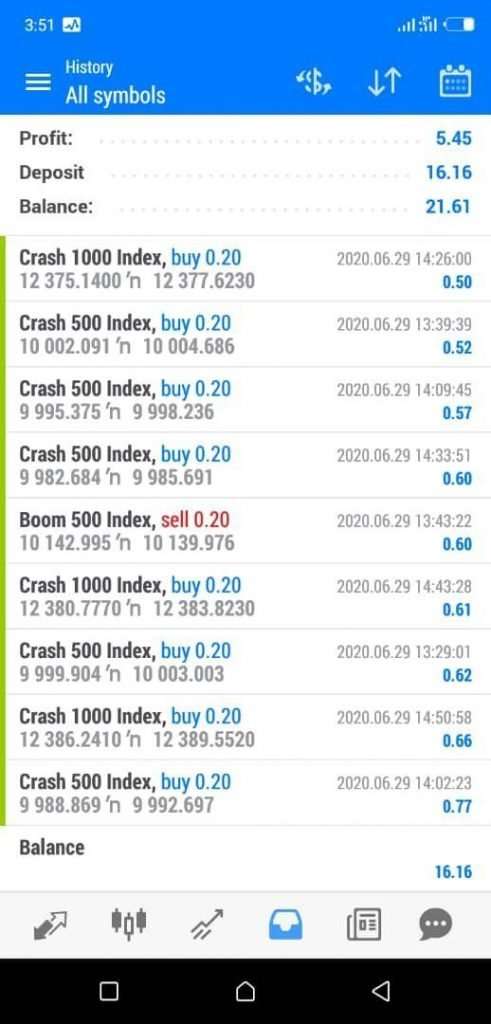
Here is a screenshot of a result from a small account
What you need for this strategy to work:
- Your balance should be between $15 – $20 USD or more
- Your profit target should be between $10 – $15 daily
- You need 200 EMA on your main chart and RSI period 14 on your indicator window 1
- You are using the M5 time frame only
How does it work?
When the price action gets to the RSI 30 line as illustrated in the chart below, you can buy crash after the formation of the third candle and stay in the market for just 3 pips. The buy condition can also be applied in Boom 500 and Boom 1000, but its’s important that you understand:
- The trend of the market
- Market structure
- Major and minor support and resistance point on the chart.

Trading Forex is risky and profitable. It’s very important to note that no Strategy is 100% perfect, personally i have tested and used this strategy for more than 4 months and i have over 5000% return on my equity.
I am having amazing results because, i only enter the market when the condition mentioned above are met and i exit once its 3 pips. I’ve master the art of fear and greed and I’m working strongly on my lot size.
Disclaimer
Deriv offers complex derivatives, such as options and contracts for difference (“CFDs”). These products may not be suitable for all clients, and trading them puts you at risk. Please make sure that you understand the following risks before trading Deriv products: a) you may lose some or all of the money you invest in the trade, b) if your trade involves currency conversion, exchange rates will affect your profit and loss. You should never trade with borrowed money or with money that you cannot afford to lose.
Pls what do u mean by after 3 candles close please explain in details in 5minutes time frame
Hello, Thants for thst good information, please explain more on the exit
Pls,where can I find 200 EMA INDICATOR
On moving everages… the difference is its a ‘Exponential Moving Everage’ , it’s a 200
I want to know how many pips I need to 15 dollars daily
It depends on your equity and leverage
20 entries with smallest lot size of 0.20 should give you $14.
I want to Know how many pips I need to make 15 dollars daily please assist am just beginner
Please where do I find 200 EMA indicator
Please where do I find the 200EMA indicator
Go to your Indicators, select moving averages, when the tab opens, you’ll see where it says period, change that to 200,
Type of Moving average, it’s usually simple by default, select that and change it to exponential… That’s EMA200
Sir, I think you made mistake.
5Minutes timeframe or 1Minute timeframe?
Because your result shows that you using 1minute timeframe
Is safer to use 5mins.
Sir, I think you made mistake.
5Minutes timeframe or 1Minute timeframe?
Because your result shows that you using 1minute timeframe.
And about the 200 EMA,
It must be above Boom price before the 70 level RSI trades?
Also Below price on CRASH before entry at 30 level RSI?
Good observation but what does 200 stand for?
Bro im a beginner and I seriously need help how can I get into contact with you here is my number 0813992837
just do as he said
Thanks Man for the info I came back to say thank you.. it’s working..
Thanks for this encouragement…
Am gonna try..
on which time frame does this strategy apply coz on 1 minute time frame there are many candles forming instead of 3
Good day,your information has in lightened me.Hoping that I will be trading soon.with you I feel that I can profit. Thank you
He used M5 you can see that at the edge of the price at the top, and the entry points are marked out on the RSI. Then you can see he targeted 3pips actually from the profit table.
Thanks so much author
Helpful
Can l have your number sir.. So that l can communicate with you on what’sapp.. Please
Very simple and working strategy especially for beginners that are not greedy and willing to take it little by little. But coming to your EMA, pls what does the 200 stand for? Thanks
Nice Strategy, but what zoom level is best to get the accurate reading??