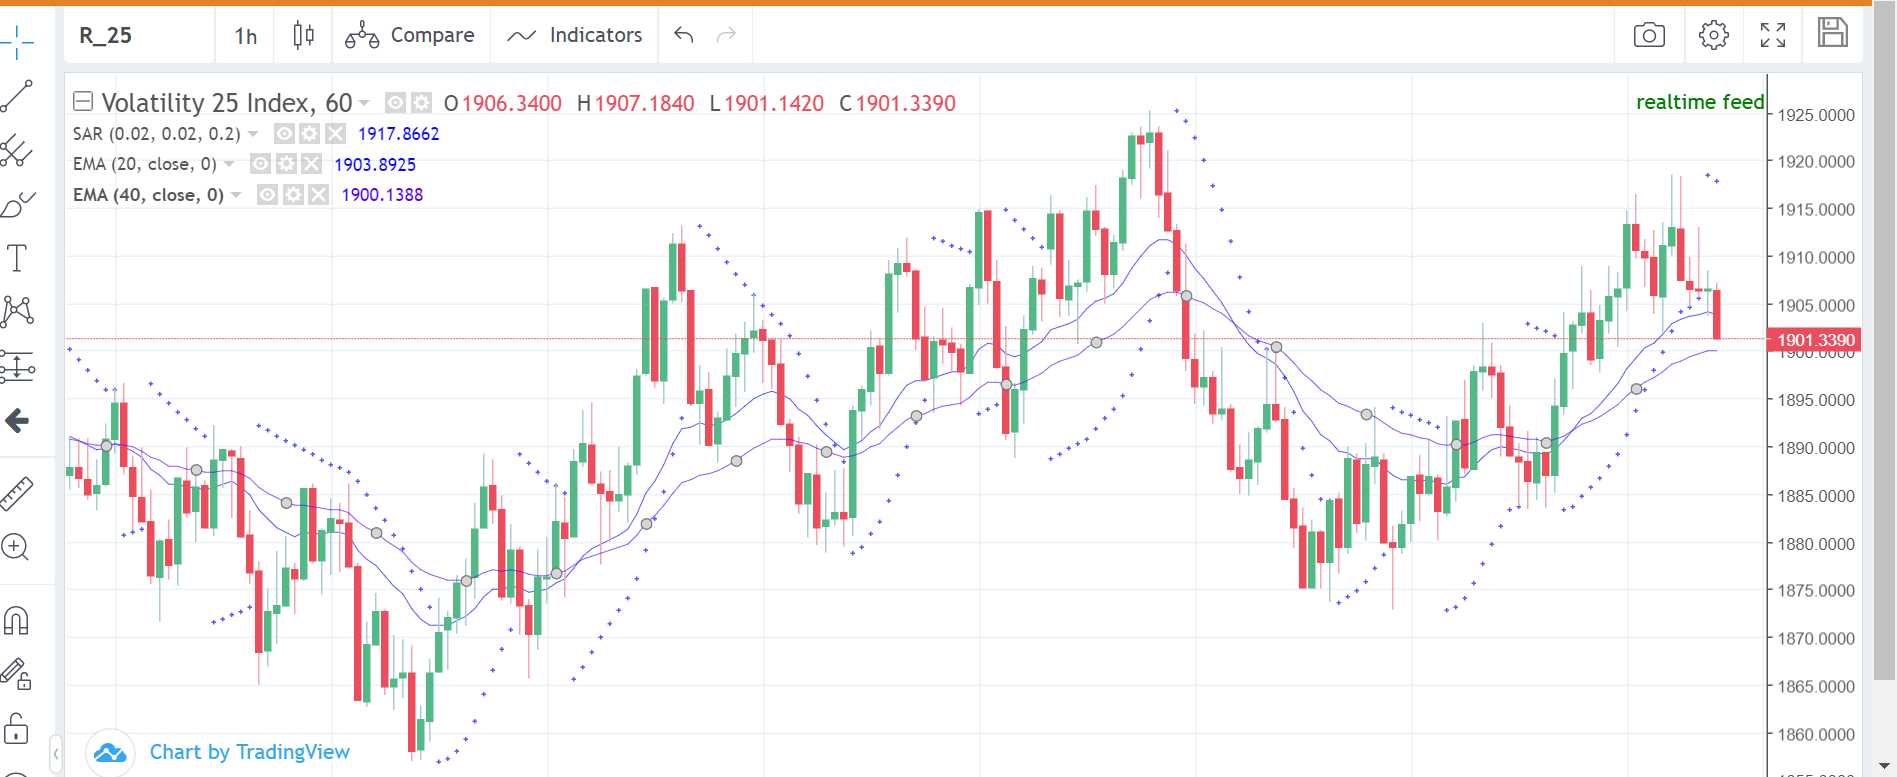
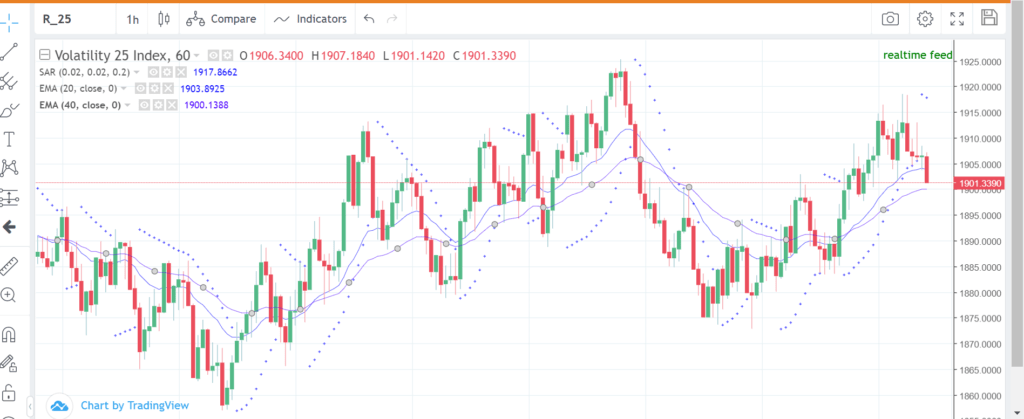
Parabolic Sar is an indicator that is used by many professional traders to determine the direction of a trading asset and a possible change in the market direction. Developed by J. Welles Wilder Jr , the Indicator is best used in trending market and in combination with other indicators like the Moving average.
Learn the Secret of Forex Trading, Click here to download a free e-book now
The indicator appears on the chart as a series of dots guiding a trader on a possible direction of the market, either below price candle for an uptrend or above price candle for a downtrend.
Table of Contents
Why is Parabolic Sar Used only in Trending Market
The Indicator is used mainly in trending market because in a sideway market or a range, the indicator can give multiple poor trading signals. So as a rule of thumb, it’s best to avoid taking signals from the indicator in a ‘choppy’ market situation where the market is moving sideways.
Advantage of the Indicator
- The Parabolic Sar help traders to determine when a current market trend will end. it does this by showing a dot above or below the price candle.
- For instance, If the dot is above the price candle it’s a sell signal or downtrend, if It’s below its a signal for a buy or uptrend
- When combine with the moving average and a little price action analysis, it can give high probability winning trades.
- It can help a trader to determine suitable entry and exit point on the market
How to Use the Parabolic Sar and Moving Average Trading Strategy
The Parabolic Sar indicator moves with price, it rises when the price rise and fall when the price fall. To use this indicator, you need to combine it with Moving Average and price action analysis for the best result.
Most traders don’t like doing in-depth analysis of any market before placing trade, they just follow the flow, sometimes they are lucky, sometimes, they blow their account. If you have followed my series of article you will understand that I am always of the opinion that the greatest asset of a trader is his/her ability to analyze the market.
This strategy can be used on any timeframe, but you have to pay attention to price action analysis.
The Setting
1. Add Parabolic SAR (Default setting) to your chart
2. Add 20 Exponential Moving Average
3. Add 40 Exponential moving Average
How to determine a Sell entry
Step 1: The Parabolic Sar should be above the price candle
Step 2: The 20 EMA will cross and go below the 40 EMA downward
Step 3: Once You notice the Moving Average crossover, wait for the dots to appear by the crossover
Step 4: Enter the next candle. Place your TP just before your next strong support based on price action analysis and stop loss few pips after the nearest strong resistance.
How to determine a Buy entry
Step 1: The dot should be below the price candle
Step 2: The 20 EMA will cross and go above the 40 EMA upward
Step 3: Once You notice the Moving Average crossover, wait for the dots to appear by the crossover
Step 4: Enter the next candle. Place your TP just before your next strong Resistance based on price action analysis and stop loss few pips after the nearest strong support.
Final Thoughts
To be successful with this strategy, you need to test it on your demo account and adjust the EMA setting to fit your trading need. Also Risk management is very important in trading, risk wisely.
Risk Disclaimer
Deriv offers complex derivatives, such as options and contracts for difference (“CFDs”). These products may not be suitable for all clients, and trading them puts you at risk. Please make sure that you understand the following risks before trading Deriv products: a) you may lose some or all of the money you invest in the trade, b) if your trade involves currency conversion, exchange rates will affect your profit and loss. You should never trade with borrowed money or with money that you cannot afford to lose.