If you are looking for how to analyze boom and crash on trading view, then this short guide was written just for you.
Boom and Crash are synthetic indices available only on Deriv.com platform; There are one of the few forex asset that is tradable 24/7 with the same leverage, thus giving traders the option to take control of their trading time and make more profit for themselves.
Because of the unique nature of synthetic indices, many traders are currently exploring and trading the market. Some are making good profit, while others are struggling between blown accounts and small profit. In this article, we will look at how to analyze boom and crash on trading view.
Table of Contents
How Forex Trader blow their Boom and Crash Account?
We have written an extensive article on how forex traders blow their account, but for the sake of this article, I want to provide a little background to guide you in your search to find meaningful strategy that will help you win in the forex market.
I want to sum up these reasons into two broader component: Fear and Greed
Fear
My first encounter with synthetic indices was very unique. I traded only Crash 500; and I was making short gains from short term buys, but anytime there were series of spikes, I will close the market in reds. It was so alarming that I could be making maybe $2 per Crash buy but loses up to $7 or more when the spikes got me. So I decided to also sell crash 500, most times the spikes took so long to come that I sometimes close in red, but immediately I close, the spikes will start coming. I became very confuse and I was always so afraid of placing trades.
As I continue to practice, I realize that nearly all my trades analysis were right, but fear made me to close them prematurely, so I started putting stop loss and take profit on my trades and the profit I got was massive.
Greed
The second thing that I struggle with, when I overcame fear was greed. For instance I will make up to $50 in a day with a $300 equity and I won’t stop trading, until some trades will hit stop loss and I will be under pressure to recover back my profit. So in the process of trying to recover back, I will make some bad decision due to emotion, which will lead me to lose more trades.
I overcome this challenge by developing a target based trading strategy. A target based strategy enable you to set a bench mark for profit and lost every trading day, thus encouraging you to take trading more serious. For example for a $500 account, I target $50 profit everyday and $20 lost every day. Which means once I reach $50 profit, I wont trade again for the day or If I lose trade up to $20 in a trading day, I won’t trade again for that day, instead I will review my trading history to know why I lose the trades.
How to analyze boom and crash on trading view
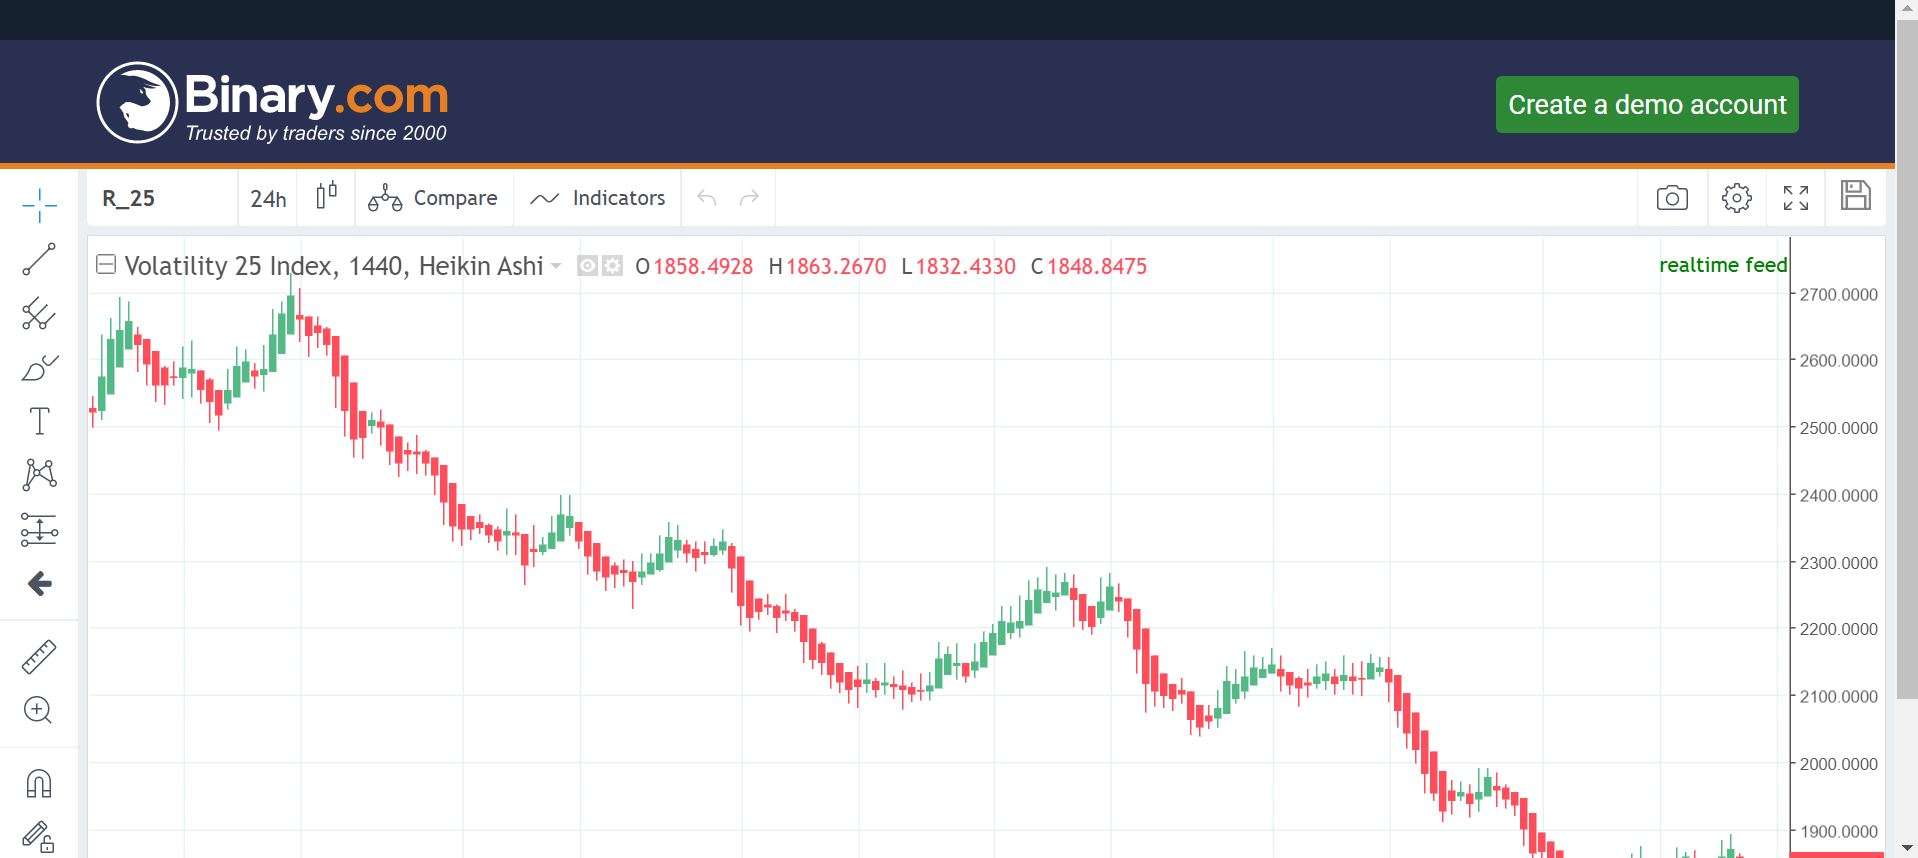
Step 1: Head over to trading view by clicking here;
A page like the one on the screenshot below will come up.

Step 2: Change the asset to your desire indices
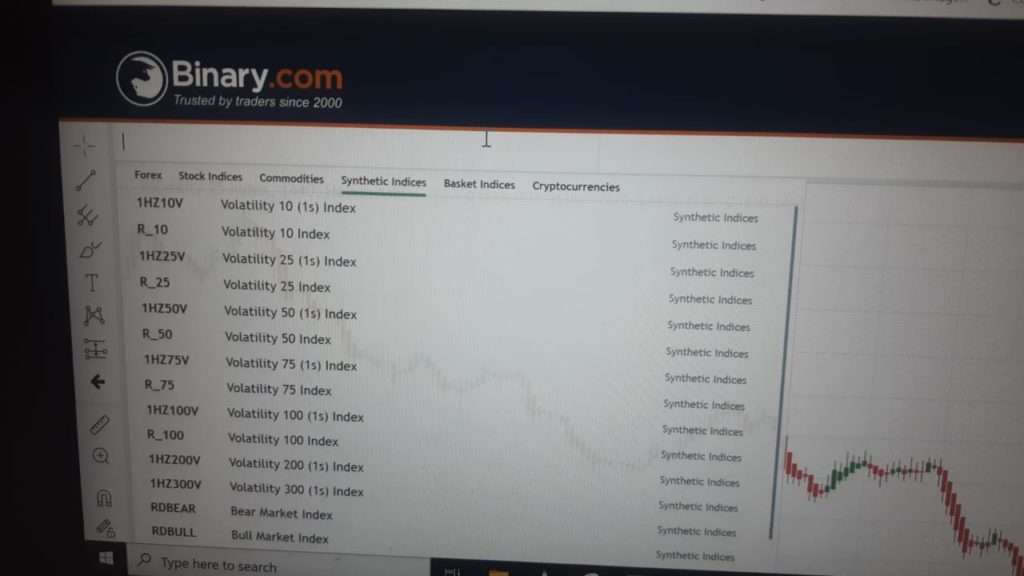
The default asset on trading view when using Deriv interface is Volatility 25 index. You can change it to any other asset by following the screenshot below:
-
Head over to where you have R-25 on the chart

-
Delete the R_25 and the other asset will come up.
Then select the one you want to analyze and you are good to go.
Step 3: Analyze
You can add any technical indicator on your chart to help you in your analysis. The reason I enjoy using trading view to analyze my trades is that it makes me to have a wider view of the market, which means I can easily draw out some point of interest on the chart, then head back to my trading app to mark them and wait for price to get there.
Step 4: Trade
Once you have done analyzing on Trading view, head back to your trading platform to mark your point of interest and prepare to trade once the price get to your point of interest. Always remember trading the financial market is risky, always risk what you can afford to lose.
Disclaimer
Deriv offers complex derivatives, such as options and contracts for difference (“CFDs”). These products may not be suitable for all clients, and trading them puts you at risk. Please make sure that you understand the following risks before trading Deriv products: a) you may lose some or all of the money you invest in the trade, b) if your trade involves currency conversion, exchange rates will affect your profit and loss. You should never trade with borrowed money or with money that you cannot afford to lose.
Hi
I would like learn the trade