In the next few minutes you are going to understand my number one spike strategy for Boom and Crash. Please if you are still confuse after reading this article , kindly drop a comment below this post and I will try and respond to your questions as soon as I can.
One of the fastest ways of making it big in Forex trading is to trade Boom and Crash.. As a successful Forex trader for over 12 year, I’ve never come across any pairs as simple in terms of analysis as Boom and Crash. But I’m always surprise when some people find it hard to understand how to consistently make profit from the market.
Don’t be left out, Open a free Boom and Crash trading account now by clicking here
I am here to assist you to become profitable in the market, let me tell you this, the reason why most people fail at trading is because of lack of knowledge, greed, fear and impatience, if you can get the knowledge, overcome fear and greed, then learn to be patience with yourself and follow through your analysis you will be successful in the market
My Number one Spike strategy for Boom and Crash
Let look at the market this way:
For Crash, it start by buying up, then suddenly spikes occur, it try to buy again, then spikes occur sometimes almost immediately or it may take a longer period of time depending on the direction of the market.
For Boom, it start by selling down, then suddenly spikes occur, it try to sell again, then spikes occur sometimes almost immediately or it may take a longer period of time depending on the direction of the market. So it is safe to say that Boom is the opposite of Crash.
But what causes spikes to occur in Boom and Crash?
I started asking this question, the first day I was introduced into the Boom and Crash Market, because I knew if I could understand the cause of spikes, I will be able to develop a spike strategy for Boom and Crash that will help me win in the market.
My mentor then introduced me to the statement on each of the indices on Meta trader 5.
“On average 1 drop occurs in the price series every 1000 tick” for Crash 1000.
“On average 1 spike occur in the price series every 1000 tick” for Boom 1000.
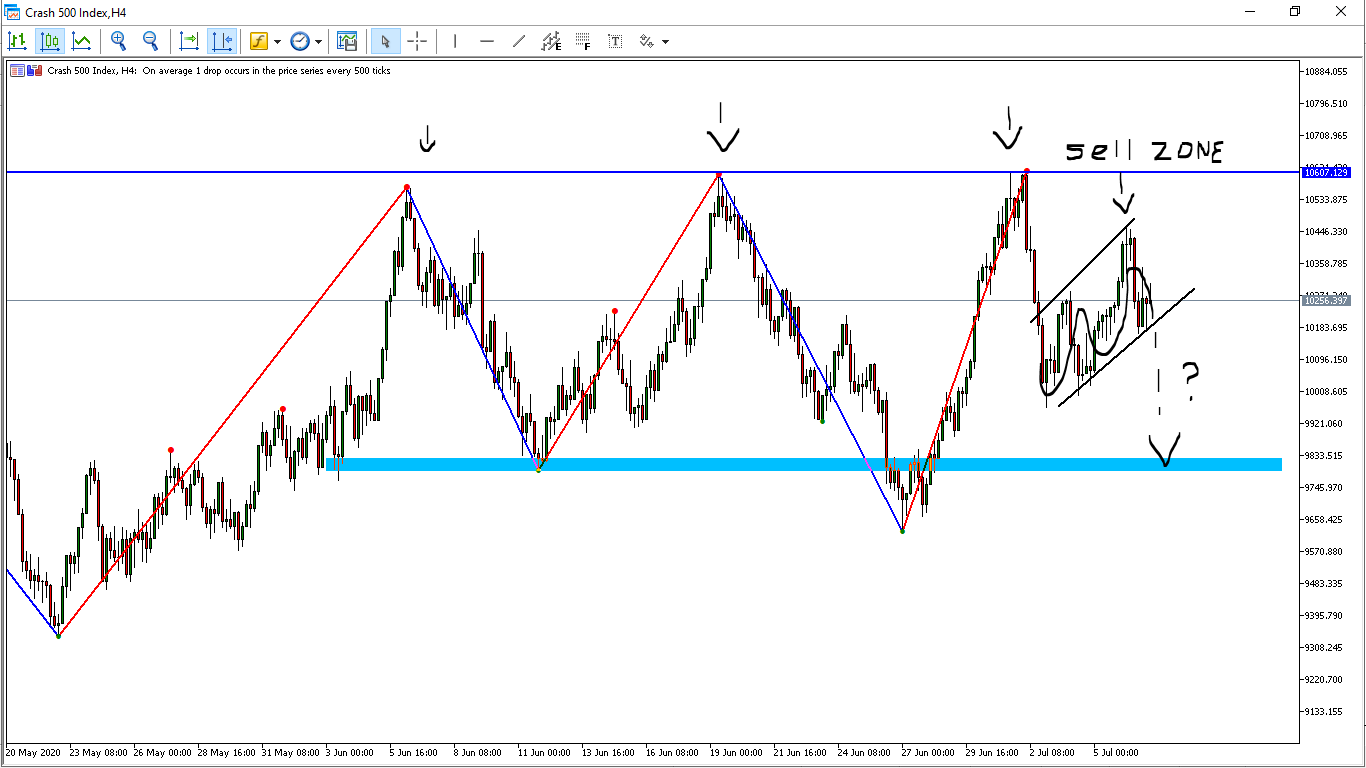
“On average 1 drop occurs in the price series every 500 tick” for Crash 500. and
“On average 1 spike occurs in the price series every 500 tick” for Boom 500.
I started trying to understand what each statement means but it wasn’t easy at first, it took me about one full day of intensive research to finally understand their meaning.
Since the drop or spike is based on tick, what is a tick?
A tick denotes a market’s smallest possible price movement to the right of the decimal. In a plain term each increment in the digit of price is a tick. A price change, from 2.8066 to 2.8067 would represent one tick. Having established this, I started counting the tick for C1000 and I realize that before it reaches 1000 tick there will be a drop, the same goes for the other indices.
This discovery enable me to develop my spike strategy for boom and crash. I always advised newbies to focus on catching the spike especially when the trend is right because its one of the best risk management strategy I’ve ever come across.
What causes spike or drop in Boom and crash is the reaction of price at hot zones (support and resistance). Once price get to a hot zone, the tendency of a drop is 90%. Rather than flooding your chart with thousand of indicators, study market structure and price action, because they will assist you to detect where spike will occur in Boom and Crash.
The only indicator on my chart is 200 EMA. The 200 EMA assist me on higher timeframe to spot hot zone and once I spot a hot zones on the chart, I place a sell or buy limit with Take Profit on those points depending on what the market structure is saying. This is the best conservative way of trading. I have carefully avoided Stop loss, because most times the market will first hunt for Stop loss before the spike occur.
This is what you need to do.
- Insert 200 EMA on your chart
- Check D1, H4, H1, and M30, M15 and M5 for the hot zones, if possible draw a line at each zone
- Using your demo first (if you don’t have a demo click here to open one), place sell limit on each of the point
- I will advice you use different timeframe for each indices, then monitor the progress for at least a day or two
- Try and study and understand the trend of the market, in a downtrend for Crash M15, M5 and M1 hot zones works better, but on a upward trend, H4, H1, M30 and sometimes D1 works better.
- In a upward trend for Boom M15, M5 and M1 hot zones works better, while H4, H1, M30 works better for a downtrend
Disclaimer
Deriv offers complex derivatives, such as options and contracts for difference (“CFDs”). These products may not be suitable for all clients, and trading them puts you at risk. Please make sure that you understand the following risks before trading Deriv products: a) you may lose some or all of the money you invest in the trade, b) if your trade involves currency conversion, exchange rates will affect your profit and loss. You should never trade with borrowed money or with money that you cannot afford to lose.
Hello, please the hot zones you are talking about, are they resistance and supply zones?
Hello sir I’m new to this and would really like your assistance in trading boom or to understand it.
Hello sir I’m new to this and would really like your assistance in trading boom and crash or to understand it.
I’m also new need assistance
How do u use the EMA 200 to know the direction of the market
when the candle sticks trend above the 200 ema its a bulish market and vice versa
You might be the best mentor in boom and crash, boss pls be my mentor
Please Sir How did you use the EMA to know the direction of the market.I want you to be my mentor
i’m your mentor now
The 200 MA and 89 MA does not really serve as support and resistance zone. Unlike Fibonacci.
Please how.can i get in contact with you
Please how can i get contact with you on this boom and crash spike issue and how to understand it better and also want you to explain more to me.
thanks
I need to know more of this ,it seems very promising.
Atleast include pics boss. Even a YouTube channel could do… Otherwise you are good at what you are saying.. Thanks.
Help all of us we want to get benefit from your experience and knowledge sir
sir how can i count the ticks
You can count the pips
When can I start to count for the ticks in each of market? Could it be after A spike please help?
Regarding on crash and boom spike, I think I developed something interesting on how to count perfectly the spikes, hit me back and I’ll show you what I’ve been doing.
Pls sir I’m interested.
Aliyu.saniali@gmail.com
WhatsApp only. 08142484972
Hi Aliyu,
I’m very interested in your concept strategy, please add me to your WhatsApp: (+27) 0614994144
Boss this is very captivating and interesting
I would like to no more please
My WhatsApp number +2347061594044
Or emails: matthewucheokeoghene841@gmail.com
Whatsapp I will show you how this strategy works
+27638722627
“On average 1 drop occurs in the price series every 1000 tick” for Crash 1000.
“On average 1 spike occur in the price series every 1000 tick” for Boom 1000.
“On average 1 drop occurs in the price series every 500 tick” for Crash 500. and
“On average 1 spike occurs in the price series every 500 tick” for Boom 500.
All, false!
Good Day Sir
How does one identify the hot zones.This was so educational
this infor is helpful. please add me on your group Be my mentor please