Unlike Forex Currency Pairs, Boom and Crash Indices are not affected by non technical actors like news, trends and event, which means if you have a fair knowledge of the Boom and Crash market structure, you can make a sustainable income from trading Boom and Crash.
Learn the Secret of Forex Trading, Click here to download a free e-book now
In this tutorial, I am hoping to give you an overview of the Boom and Crash Market Structure, the power of market structure and how you can become a good forex trader, let’s begin.
Table of Contents
An overview of the Boom and Crash Market Structure
Stock Market Structure
Let’s start with the stock market. In the stock market, we have the Buyers, a Centralized market and the sellers. The price of stock is greatly affected by the centralized market because they set the share value and price at every time.
If at any given point, the number of those who wish to sell their share (sellers) exceed the numbers of buyers, the dealers may increase the transaction cost to prevent sellers from entering the market.
Boom and Crash Market Structure
In Boom and Crash, we have the Buyers, Decentralized market and the sellers. Unlike the stock market, the Boom and Crash market is greatly control by market orders from buyers and the sellers. However, there are some rare key moments where liquidity gaps theory comes to play. Liquidity gap occurs where there is a mismatch in the supply or demand for an asset, in such rare cases, the market will step in to fill the gap before the trend continues.
But generally, market orders define the movement in the market, that is while most traders rely on momentum indicators to guide them on when the market is overbought or oversold in order to avoid a potential liquidity gap trap.
What is Forex Market Structure?
Away from the hierarchy in the market and who controls what, Forex market structure can be defined as the movement of price in the market and your ability to read it. It’s a trend following tool that assist traders to easily identify and spot movement of asset in the market, help them understand it and give them confidence to follow same to make profit.
Meaning, in order to understand market structure, you need to know what control price movement in the market and can effectively use that information to make informed trading decisions.
What Controls Price Movement in the Market?
Based on the market hierarchy, we had already established that in the Boom and Crash market, price is control by forex market orders initiated by buyers and sellers in the market; but beyond that, successful traders don’t just open chart and place trades, they are things they see that inspire them to place trades.
This can include:
- Basic Support and Resistance level on the chart
- Swing low and Swing high
- Pivot points
- trendlines, etc.,
For instance, at a strong support zone, it is expected that even on a sell trend, there will be some reaction at that zone because of market and limit orders from buyers who based on their analyzes conclude that there maybe a price reversal at the said support zone. However, three things may happen based on this, it is either the price will bounce up at that point, consolidate at that point before making any decision or just break through.
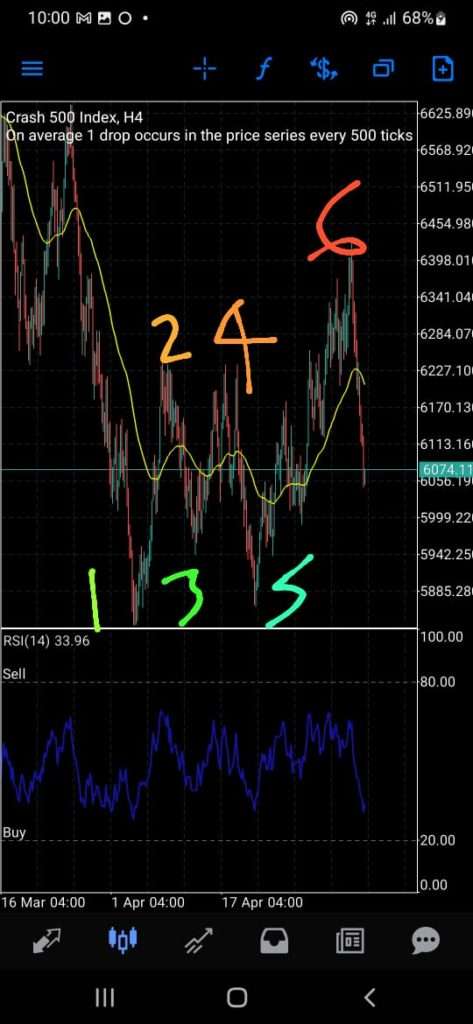
In the screenshot above, you can spot three Support zones ( 1, 3 and 5) and three Resistance zones ( 2, 4 and 6). The buys start from point 1, buy up to point 2, then start selling from point 2, sell down to point 3 and start buying again till point 4. One thing you will notice is that point 2 and 4 are almost on the same line and they were series of spikes at that point, even when there was a buy from point 5 to 6, there was still some spikes activity at point 2 and 4 meaning that the zone is a strong resistance zone.
Many successful forex traders mark these points in the market and take advantage of them when price reaches those points, because there is always a 90% probability of a spike or a bounce around those zones.
Type of Market trends you should look at for in Boom and Crash
The are three type of market trends in Boom and Crash, they include:
- Bull Trend or Uptrend
- Bear trend or Downtrend
- Consolidation or Sideways trend
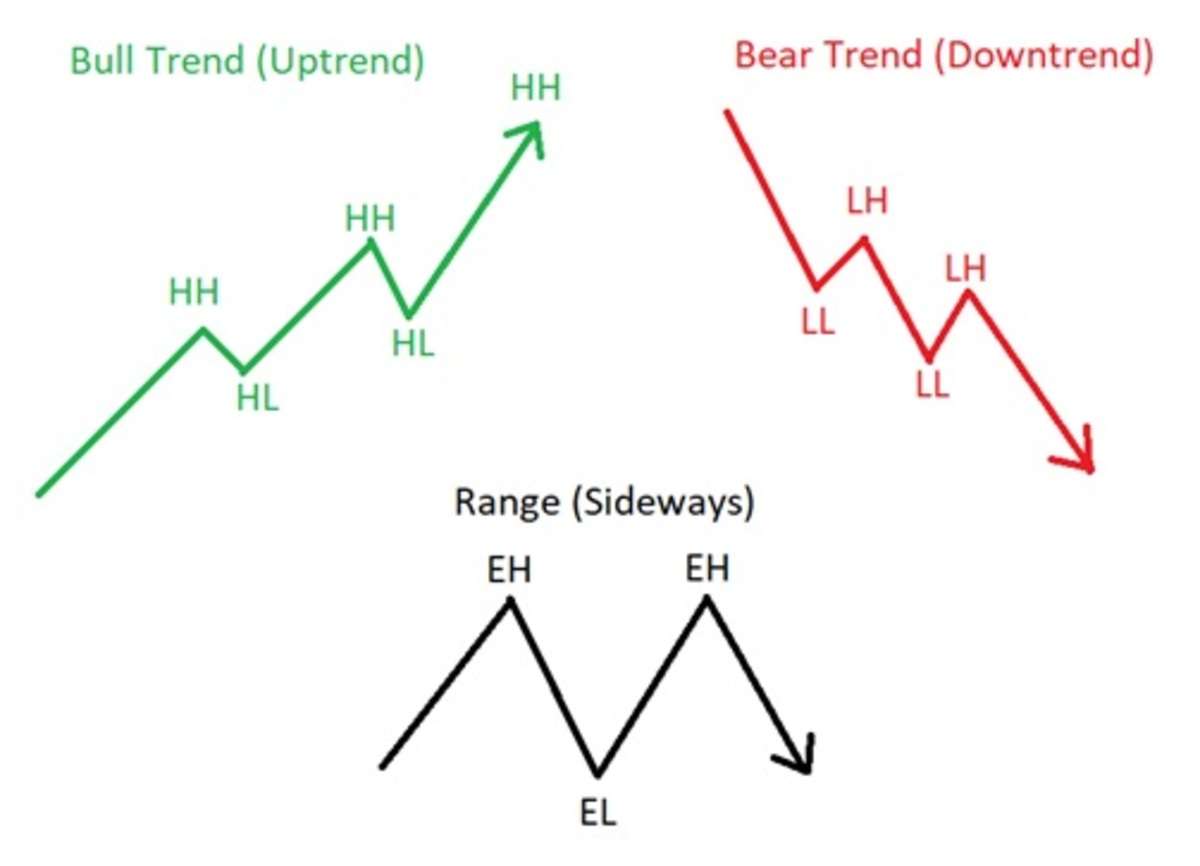
Bull or Uptrend
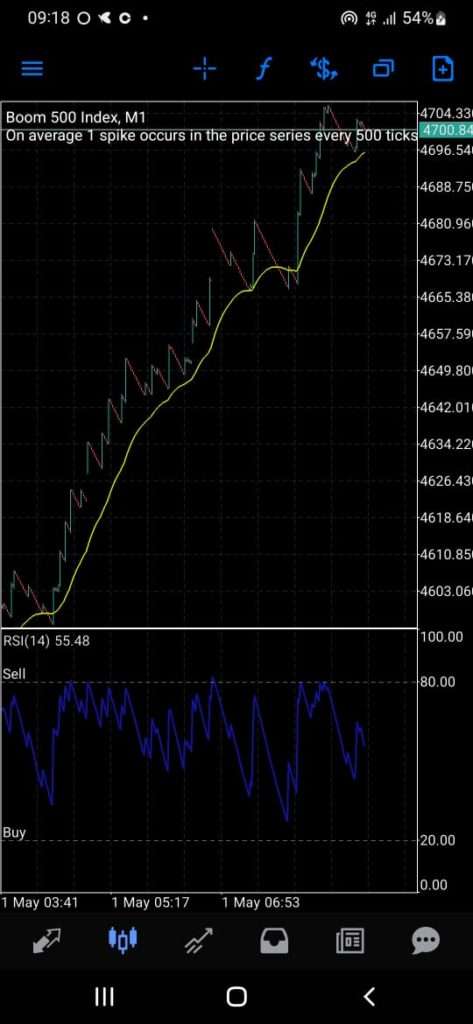
In screenshot above, the upward trend started when the price crosses the 48 Exponential Moving Average (which is the yellow line on the chart) and should move up smoothly until it gets to a strong resistance zone before making a decision either to break the zone and continue up, or consolidate at the zone and decide on next step or just reverses back to the next support. The bull trend is always depicted by series of higher highs and higher lows.
Bear trend or Downtrend
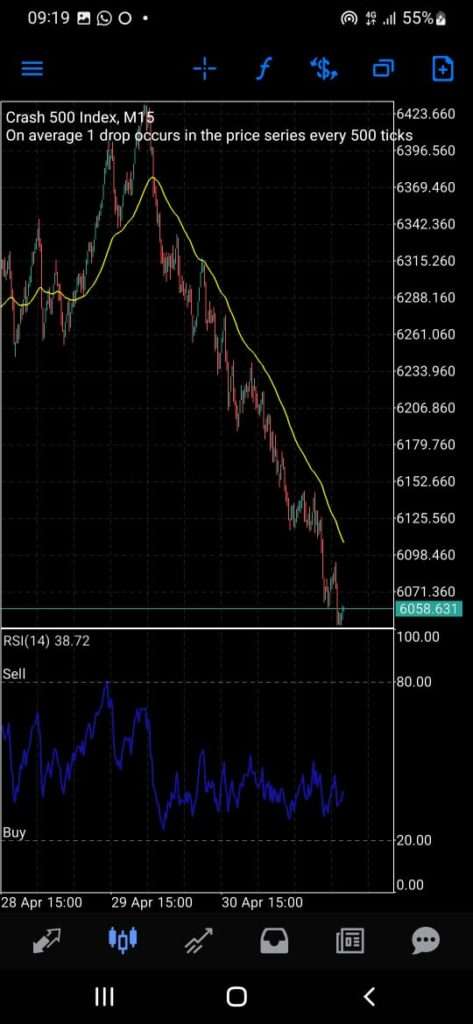
In the screenshot above, the downtrend started when the price crosses the 48 EMA downward and should continue downward until it gets to a strong support zone before deciding on next step. The bear trend is depicted by series of lower lows and lower highs
Consolidation or Sideways trend
Consolidation or sideway trend is mainly a point of indecision. This point has equal highs and equal lows. The market can stay in this zone for a long time until there is a breakout, personally, I don’t trade when there is a consolidation, because the breakout can be either way based on market order or the need to fill up a liquidity gap.
How to become a successful Trader
- Always mark your daily high and daily low at the beginning of every trading day
- Mark major support and resistance zones in the chart
- Draw your trendline
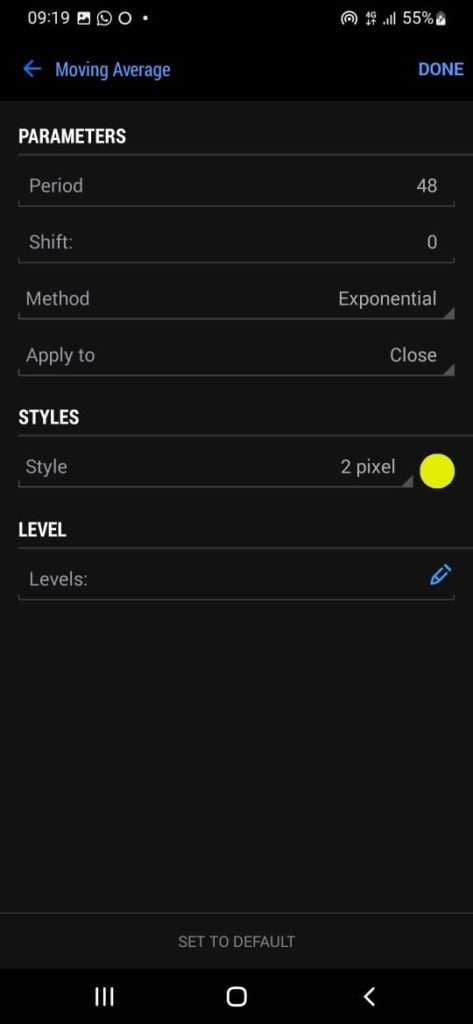
- Add 48 EMA to your chart
- Buy only at confirm support
- Sell only at confirm resistance point.
- Put your stop loss, few pips below the support zone for buys and few pips above the resistance zone for a sell
- Monitor your trades to take profit or move up your stop loss into profit
- Loses is part of trading, learn from it.
If you have any question, please drop a comment below this article.
Disclaimer
Deriv offers complex derivatives, such as options and contracts for difference (“CFDs”). These products may not be suitable for all clients, and trading them puts you at risk. Please make sure that you understand the following risks before trading Deriv products: a) you may lose some or all of the money you invest in the trade, b) if your trade involves currency conversion, exchange rates will affect your profit and loss. You should never trade with borrowed money or with money that you cannot afford to lose.
Hello Warren please I need your tutorial on boom and crash how do we get along
How does EMA works in which time frame
Hello….
Which is the best time frame to find the best support and resistance in boom and crash
i’m struggling to analyze boom and crash market. how to do it and which indicators can I use that are very accuracy